Glycemic Load vs Glycemic Index: Which Metric Matters More for Blood Sugar
Glycemic load adjusts GI for portion size using the formula GL = GI x net carbs / 100. Comparison table, categories, and why GL predicts real-world glucose response better than GI alone.
What Is Glycemic Load and How Is It Calculated?
Glycemic load (GL) is a metric that quantifies the total glucose impact of a specific food serving by combining the glycemic index (GI) with the actual carbohydrate content per serving. The formula is GL = (GI x grams of net carbohydrate per serving) / 100. GL values are classified as low (below 10), medium (11 to 19), and high (20 or above). A low-GL food produces minimal blood sugar impact regardless of its GI classification. Harvard School of Public Health researchers introduced glycemic load in 1997 to address the primary limitation of GI — its failure to account for portion size. While GI measures the speed of glucose absorption from 50 grams of carbohydrate, GL measures the magnitude of glucose impact from the amount of carbohydrate you actually eat. This distinction is critical for practical meal planning because it reveals which foods produce the largest real-world glucose responses.
Where GI and GL Disagree: The Comparison Table
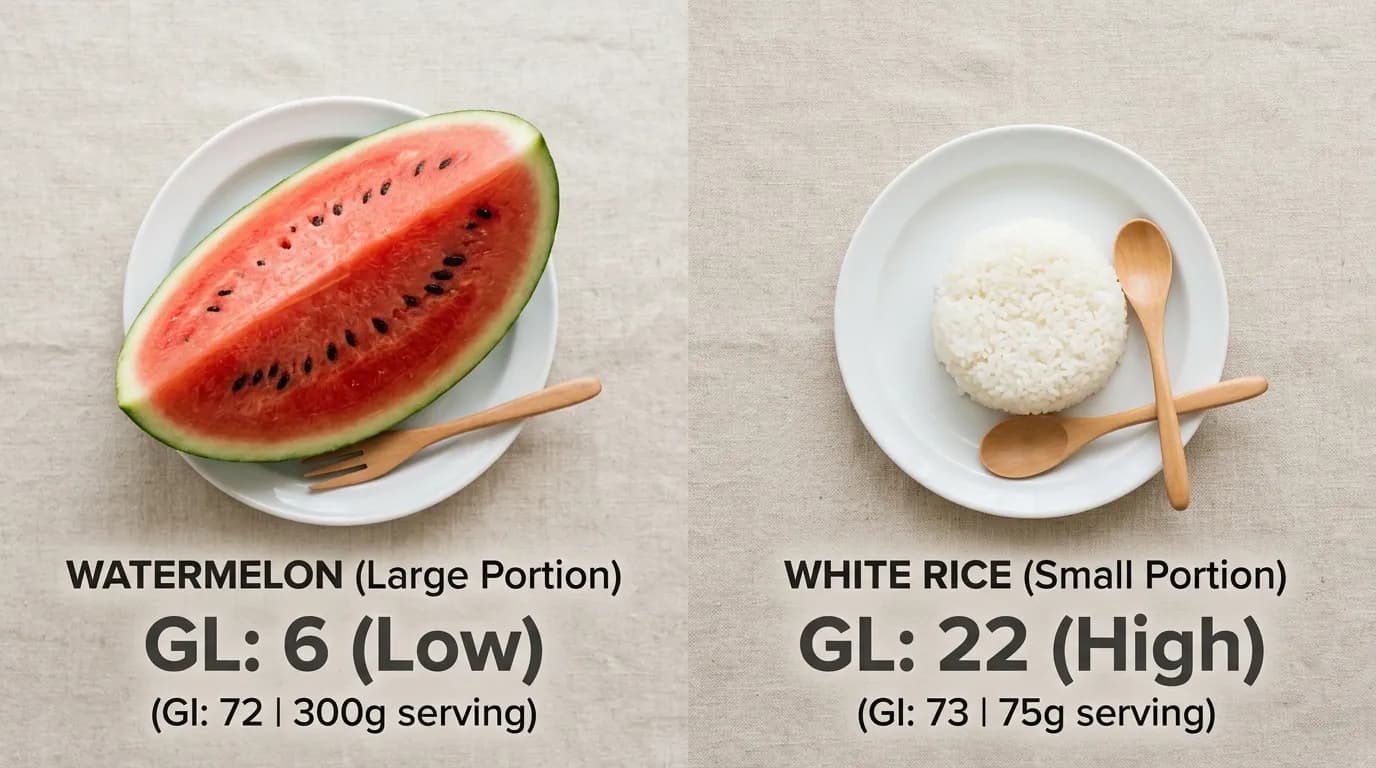
Several common foods illustrate why GL provides different — and more useful — guidance than GI alone. Watermelon has a GI of 72 (high) but a GL of only 4 per 120g serving (low) because it contains just 6 grams of carbohydrate per serving — the rest is water. Carrots have a GI of 39 and a GL of 2 per serving (both low). Baked russet potato has a GI of 85 (high) and a GL of 26 per medium potato (high) — both metrics agree this food significantly raises blood sugar. White rice has a GI of 73 (high) and a GL of 29 per cup cooked (high) — again, both metrics align. Coca-Cola has a GI of 63 (medium) but a GL of 16 per 12-oz can (medium), placing it in the moderate-impact zone rather than the high-impact zone that its sugar content might suggest. Lentils have a GI of 32 (low) and a GL of 5 per half-cup cooked (low) — one of the best choices for blood sugar stability. Raisins have a GI of 64 (medium) but a GL of 28 per small box (high) due to concentrated sugar. Apple juice has a GI of 41 (low) but a GL of 12 per cup (medium) because a standard serving delivers 30 grams of sugar. Peanuts have a GI of 14 (very low) and a GL of 1 per serving (very low) — protein and fat dominate with minimal carbohydrate.
Why Glycemic Load Better Predicts Blood Sugar Response
Three lines of evidence establish GL as a superior predictor of real-world glucose impact compared to GI alone. First, a 2008 meta-analysis published in the American Journal of Clinical Nutrition by Livesey et al. analyzed 45 prospective studies and found that dietary GL — but not GI alone — was significantly associated with type 2 diabetes risk, with each 50-unit increase in daily GL raising risk by 18%. Second, CGM data from the 2015 Weizmann Institute study showed that the glycemic load of a meal correlated more strongly with individual postmeal glucose spikes (r = 0.68) than GI alone (r = 0.47). Third, a 2019 systematic review in Nutrients found that interventions targeting total daily GL below 80 produced 40% greater improvements in fasting glucose and A1C compared to interventions targeting only low-GI food selection. The practical implication is clear: counting glycemic load per serving gives you a more accurate picture of glucose impact than categorizing foods as "low-GI" or "high-GI" without considering serving size.
How to Use Glycemic Load in Meal Planning
Targeting a daily glycemic load below 80 and keeping individual meal GL below 20 produces measurably better glucose control in CGM data. To calculate a meal's total GL, sum the GL values of each food component. A breakfast of steel-cut oats (GL 10) with blueberries (GL 3) and walnuts (GL 0) totals GL 13 — a moderate-impact meal. Replacing the oats with cornflakes (GL 21) raises the meal GL to 24 — a high-impact meal from a single substitution. Practical tips: choose whole intact grains over processed grains (barley GL 11 vs cornflakes GL 21), prioritize legumes as carbohydrate sources (lentils GL 5, chickpeas GL 8), combine high-GL foods with protein and fat to lower the effective glycemic impact, and use CGM data to verify that your calculated GL predictions match your actual glucose responses. The American Diabetes Association does not prescribe a specific GL target but recommends "individualized medical nutrition therapy" — and personal CGM data is the most precise tool for individualizing your dietary approach.