Glycemic Index Explained: 80+ Common Foods Ranked by GI Value
The glycemic index ranks carbohydrate-containing foods on a 0-100 scale by how quickly they raise blood glucose. 80+ foods ranked with GI values, categories, measurement methodology, and limitations.
What Is the Glycemic Index?
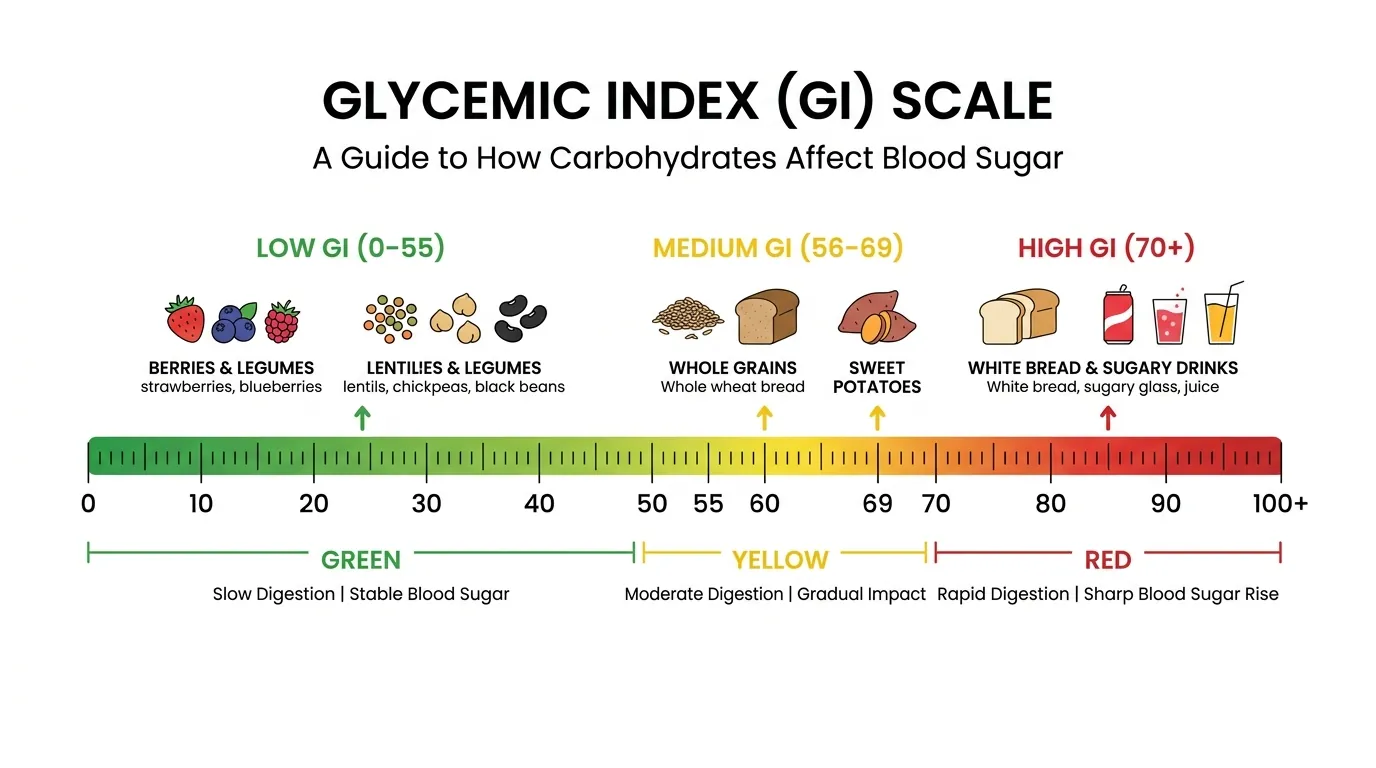
The glycemic index (GI) is a numerical ranking system that measures how quickly a carbohydrate-containing food raises blood glucose compared to pure glucose, which is assigned a GI value of 100. Developed in 1981 by Dr. David Jenkins and colleagues at the University of Toronto, the GI system was originally created to help people with diabetes identify foods that would produce the smallest glucose spikes. Foods are classified into three categories: low GI (55 or below), medium GI (56 to 69), and high GI (70 or above). A low-GI food produces a gradual, moderate rise in blood sugar over 2 to 3 hours, while a high-GI food produces a rapid spike that peaks within 30 to 45 minutes. The GI value reflects the speed of carbohydrate digestion and absorption — not the total amount of carbohydrate in a food, which is why glycemic load (GL) is often a more practical companion metric. The University of Sydney maintains the most comprehensive GI database, containing tested values for over 4,000 food items as of 2026.
How the Glycemic Index Is Measured
GI testing follows a standardized protocol established by the International Organization for Standardization (ISO 26642:2010). Ten healthy subjects fast overnight, then consume a portion of the test food containing exactly 50 grams of available (digestible) carbohydrate. Blood glucose is measured at 0, 15, 30, 45, 60, 90, and 120 minutes after eating. The area under the 2-hour glucose curve (AUC) is calculated for the test food and compared to the AUC produced by 50 grams of pure glucose consumed on a separate day. The GI equals (AUC test food / AUC glucose) x 100, averaged across all 10 subjects. This methodology has an inherent limitation: it requires consuming 50 grams of carbohydrate from each food, which means eating unrealistic portions of low-carb foods. You would need to eat 1.3 pounds of carrots or 4.2 cups of watermelon to reach 50 grams of carbohydrate — portions far larger than anyone would eat in a single sitting. This is the fundamental reason why GI alone can be misleading and why glycemic load, which adjusts for actual serving sizes, provides a more accurate picture of real-world glucose impact.
Glycemic Index Rankings: 80+ Common Foods
Grains and Breads: white bread 75, whole wheat bread 74, sourdough bread 54, pumpernickel bread 50, white rice 73, brown rice 68, basmati rice 58, parboiled rice 38, wild rice 57, instant oatmeal 79, steel-cut oats 55, rolled oats 57, quinoa 53, bulgur wheat 48, corn tortilla 52, white pasta (al dente) 46, white pasta (overcooked) 64, couscous 65, cornflakes 81, bran flakes 74, muesli (no sugar) 49. Fruits: apple 36, banana (ripe) 62, banana (green) 42, orange 43, grapes 59, watermelon 72, pineapple 66, mango 56, strawberries 41, blueberries 53, cherries 22, pear 38, peach 42, plum 39, dried dates 103, raisins 64, grapefruit 25, kiwi 47, papaya 60. Vegetables: potato (baked russet) 85, potato (boiled, cooled) 56, sweet potato 63, carrots (boiled) 39, peas 48, corn 52, parsnip 97, pumpkin 75, beets 64, butternut squash 51. Legumes: lentils 32, chickpeas 28, black beans 30, kidney beans 24, navy beans 31, soybeans 16, peanuts 14, hummus 6. Dairy: whole milk 39, skim milk 37, Greek yogurt (plain) 11, ice cream 51, cheddar cheese 0. Snacks and Sweets: rice cakes 82, popcorn 65, pretzels 83, dark chocolate (70%+) 23, milk chocolate 43, honey 61, maple syrup 54, white sugar (sucrose) 65, corn syrup 90. Beverages: orange juice 50, apple juice 41, cola 63, sports drink 78, beer 66. These values are averages from the University of Sydney GI database and may vary by brand, preparation, and individual metabolism.
Factors That Change a Food's Glycemic Index
A food's GI value is not fixed — it changes based on preparation, ripeness, processing, and what you eat alongside it. Cooking time increases GI: al dente pasta (GI 46) scores 18 points lower than overcooked pasta (GI 64) because the shorter cooking time preserves more resistant starch. Ripeness affects fruit: a green banana (GI 42) has significantly more resistant starch than a ripe banana (GI 62), where the starch has converted to sugar. Processing strips fiber and cell structure: whole oats (GI 55) become instant oatmeal (GI 79) when the grain is rolled thinner and pre-cooked. Cooling after cooking creates retrograde starch: a baked potato eaten hot (GI 85) produces a larger spike than the same potato cooled and eaten as potato salad (GI approximately 56). Combining foods at the same meal modifies the composite GI: adding fat, protein, or acidic ingredients (vinegar, lemon juice) to a high-GI food reduces the effective glycemic response by 20 to 35%. These variables are why GI tables should be used as a starting guide rather than an absolute predictor — and why a continuous glucose monitor is the most accurate way to determine your personal response to specific foods and preparations.
Limitations of the Glycemic Index
The glycemic index has 5 significant limitations that users should understand. First, GI does not account for portion size — a food with a high GI may have minimal glucose impact in the amount typically consumed (as with watermelon). Second, GI is measured in isolation, but people rarely eat single foods — the composite glycemic effect of a mixed meal depends on all components. Third, GI values are averages from 10 subjects and may not reflect your individual response; the 2015 Weizmann Institute study by Zeevi et al. demonstrated that individual GI responses to the same food varied by up to 4x. Fourth, GI does not account for insulin response — some foods (like dairy products) produce a disproportionately large insulin response relative to their GI, an effect measured by the less commonly used insulin index. Fifth, GI only applies to carbohydrate-containing foods — meats, fats, and non-starchy vegetables with negligible carbs have a GI of 0 or are untestable. For these reasons, the glycemic load metric provides a more practically useful framework, and personal CGM testing provides the most accurate food-glucose data available. See the glycemic load guide for a full comparison of these two metrics.