Insulin Resistance Explained: Causes, 14 Symptoms, and Reversal Strategies
Insulin resistance occurs when cells stop responding normally to insulin, forcing the pancreas to overproduce. 40% of US adults are affected. Causes, 14 symptoms, HOMA-IR testing, and evidence-based reversal strategies.
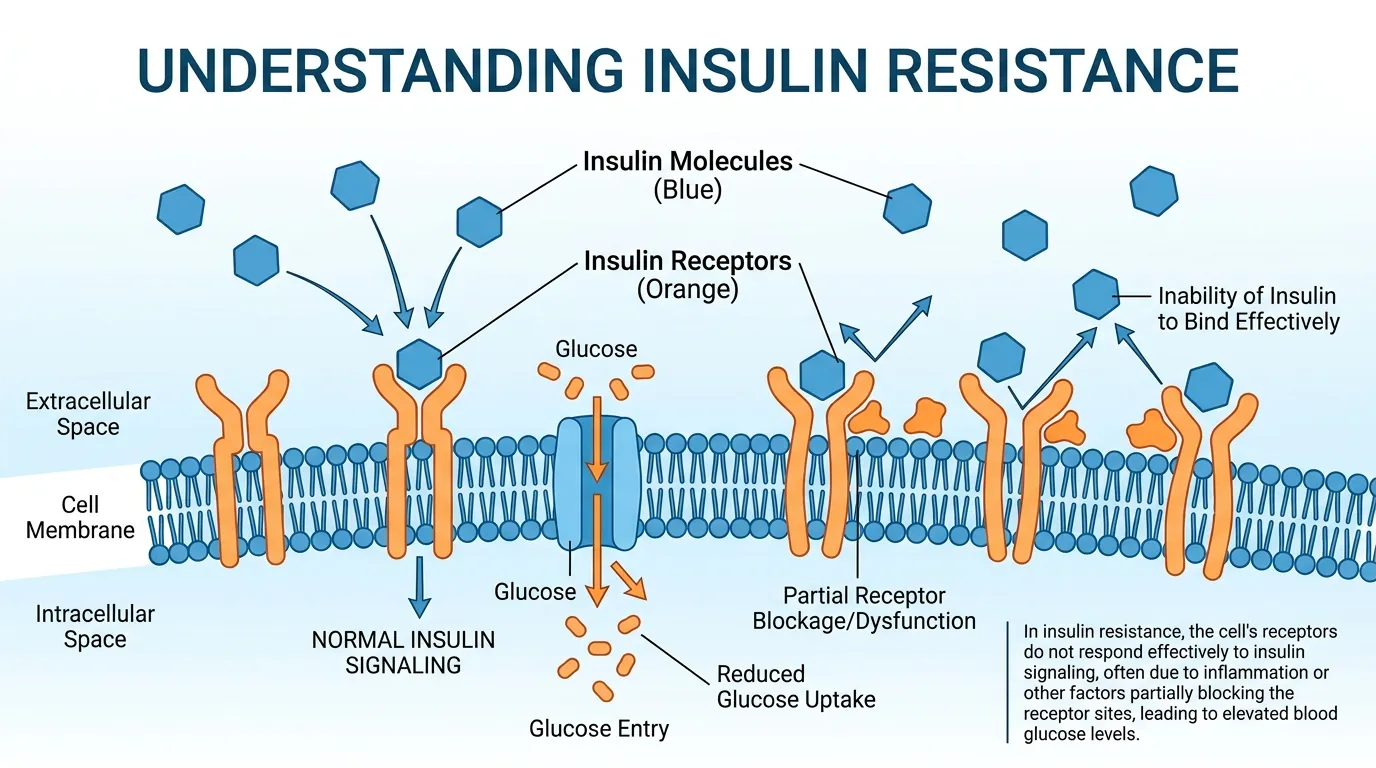
What Is Insulin Resistance?
Insulin resistance is a metabolic condition in which muscle, fat, and liver cells fail to respond adequately to normal levels of the hormone insulin, forcing the pancreas to secrete progressively larger amounts to maintain blood glucose within a safe range. Insulin is the primary anabolic hormone responsible for shuttling glucose from the bloodstream into cells for energy production or storage. When cells become resistant, glucose remains elevated in the blood for longer periods after meals, and the pancreas compensates by producing 2x to 5x more insulin than a healthy person requires — a state called hyperinsulinemia. An estimated 40% of U.S. adults aged 18-44 have some degree of insulin resistance according to a 2022 JAMA Network Open analysis, making it the most common metabolic disorder in developed nations. The condition is particularly insidious because it produces no obvious symptoms in its early stages and is invisible to standard blood tests that only measure fasting glucose. Fasting glucose remains normal for 10-15 years while insulin resistance worsens silently, because the excess insulin successfully forces glucose into cells. Only when the pancreas begins to fail — unable to sustain the elevated production — does fasting glucose rise above 100 mg/dL and the condition becomes detectable through conventional lab work.
14 Symptoms of Insulin Resistance
Insulin resistance produces 14 clinically recognized signs and symptoms, though many overlap with other conditions and none is individually diagnostic. The 14 symptoms are: (1) persistent fatigue, especially after meals, caused by impaired cellular glucose uptake; (2) brain fog and difficulty concentrating, resulting from glucose variability in cerebral tissue; (3) increased hunger and carbohydrate cravings, driven by elevated insulin stimulating appetite centers in the hypothalamus; (4) weight gain concentrated around the waist and abdomen (visceral adiposity), the hallmark body composition change of insulin resistance; (5) dark, velvety patches of skin on the neck, armpits, or groin called acanthosis nigricans, caused by insulin stimulating keratinocyte and dermal fibroblast proliferation; (6) skin tags (acrochordons), particularly on the neck and underarms, associated with elevated insulin and IGF-1 levels; (7) elevated fasting insulin above 12 uIU/mL on blood work; (8) high triglycerides above 150 mg/dL; (9) low HDL cholesterol below 40 mg/dL in men or 50 mg/dL in women; (10) elevated blood pressure above 130/85 mmHg, caused by insulin-mediated sodium retention in the kidneys; (11) polycystic ovary syndrome (PCOS) symptoms in women — irregular periods, excess androgen production, and ovarian cysts — with insulin resistance present in 70-80% of PCOS cases; (12) non-alcoholic fatty liver disease (NAFLD), present in 80% of people with insulin resistance, detectable through elevated ALT on blood work or ultrasound; (13) frequent urination and increased thirst when glucose begins spilling into urine above 180 mg/dL; and (14) slow wound healing caused by impaired microcirculation and elevated inflammatory markers.
What Causes Insulin Resistance?
Five primary factors drive the development of insulin resistance, and most people have multiple overlapping causes. Excess visceral fat is the strongest modifiable risk factor — adipose tissue surrounding the liver, pancreas, and intestines secretes inflammatory cytokines (TNF-alpha, IL-6, resistin) that directly impair insulin signaling in adjacent cells. A waist circumference above 40 inches in men or 35 inches in women indicates elevated visceral fat. Sedentary lifestyle reduces the expression of GLUT4 glucose transporters on muscle cell surfaces — these transporters are the molecular gateways through which insulin moves glucose into cells. Physical inactivity reduces GLUT4 density by up to 50% within 2 weeks of becoming sedentary. Chronic low-grade inflammation, measured by hs-CRP above 3.0 mg/L, disrupts insulin receptor substrate-1 (IRS-1) phosphorylation, the critical first step in insulin signaling inside cells. Genetic predisposition accounts for 40-70% of insulin resistance heritability based on twin studies — certain populations (South Asian, Hispanic, Pacific Islander, Native American) have 2-3x higher rates of insulin resistance at any given BMI. Poor sleep quality and duration — sleeping fewer than 6 hours per night — increases cortisol by 37% and reduces insulin sensitivity by 40% within 6 days according to Spiegel et al. (1999, The Lancet). These 5 causes interact synergistically: a genetically predisposed individual who is sedentary, sleep-deprived, and carrying excess visceral fat develops insulin resistance far faster than any single factor alone would produce.
HOMA-IR: How to Test for Insulin Resistance
The Homeostatic Model Assessment of Insulin Resistance (HOMA-IR) is the most widely used clinical calculation for estimating insulin resistance from a simple blood draw. The formula is: HOMA-IR = (fasting insulin in uIU/mL x fasting glucose in mg/dL) / 405. Both values must come from the same fasting blood sample, drawn after 8-12 hours without food. Interpretation: a HOMA-IR below 1.0 indicates excellent insulin sensitivity. Values between 1.0 and 1.9 are considered normal but warrant monitoring if other risk factors are present. A HOMA-IR above 1.9 suggests early insulin resistance. A HOMA-IR above 2.9 indicates significant insulin resistance that likely requires intervention. Values above 5.0 are associated with a 3-fold increased risk of developing type 2 diabetes within 5 years. For example, a fasting insulin of 15 uIU/mL and fasting glucose of 95 mg/dL produces a HOMA-IR of (15 x 95) / 405 = 3.52, indicating significant insulin resistance despite a perfectly normal fasting glucose. This illustrates why fasting insulin — not fasting glucose — is the earliest and most sensitive marker. The limitation of HOMA-IR is that it reflects hepatic (liver) insulin resistance more than peripheral (muscle) insulin resistance. The gold standard test is the hyperinsulinemic-euglycemic clamp, but this 4-hour procedure is reserved for research settings. For clinical screening, HOMA-IR is sufficient and costs only $25-$75 for the two blood tests required.
Evidence-Based Strategies to Reverse Insulin Resistance
Insulin resistance is reversible in the majority of cases through lifestyle modification, and improvements begin within days of starting intervention. The Diabetes Prevention Program (DPP) trial demonstrated that 150 minutes per week of moderate-intensity exercise combined with 5-7% body weight loss reduced the progression from prediabetes to type 2 diabetes by 58% — nearly double the effect of metformin medication (31%). Exercise improves insulin sensitivity through 2 mechanisms: acute glucose uptake via muscle contraction (which moves glucose into cells independent of insulin) and chronic upregulation of GLUT4 transporters (which increases insulin-mediated glucose uptake for 24-48 hours after each session). Dietary changes that reduce refined carbohydrates and increase fiber, protein, and healthy fats lower postmeal insulin demand by 30-50% per meal. Time-restricted eating within a 10-hour window improved insulin sensitivity by 36% in metabolic syndrome patients after 12 weeks in a 2020 Cell Metabolism trial by Wilkinson et al. For pharmacological support, metformin reduces hepatic glucose production and improves insulin sensitivity by 15-20%, while berberine (a plant alkaloid) showed comparable efficacy to metformin in a 2008 Metabolism trial. Weight loss of just 5% reduces visceral fat volume by 10-15% and normalizes inflammatory cytokine levels. Sleep optimization to 7-9 hours restores cortisol rhythm and insulin sensitivity within 2 weeks. A CGM accelerates reversal by providing immediate feedback on which foods and activities produce the best glucose responses for your individual physiology — this personalized data eliminates guesswork and increases adherence to dietary changes.
How CGMs Detect Insulin Resistance Before Blood Tests
A continuous glucose monitor reveals insulin resistance through dynamic glucose patterns that static blood tests miss entirely. The most sensitive CGM-derived marker is postmeal glucose recovery time — the number of minutes required for glucose to return to within 10 mg/dL of the pre-meal baseline. A metabolically healthy person with normal insulin sensitivity returns to baseline within 60-90 minutes after a standard meal. A person with early insulin resistance typically requires 120-180 minutes, and their peak glucose after meals is 20-40 mg/dL higher than a healthy responder eating the same food. This pattern is visible on a CGM months to years before fasting glucose rises above 100 mg/dL. The second pattern is elevated fasting glucose variability — a coefficient of variation above 20% in overnight readings between 2 AM and 6 AM suggests cortisol-driven hepatic glucose output, which worsens as insulin resistance progresses. The third pattern is the dawn phenomenon: a glucose rise of 15-30 mg/dL between 4 AM and 8 AM caused by cortisol and growth hormone secretion that the liver responds to by releasing stored glucose. In insulin-sensitive individuals, the pancreas produces enough insulin to blunt this rise. In insulin-resistant individuals, the rise is pronounced and can push fasting glucose to 110-130 mg/dL by morning — even though glucose was 85 mg/dL at midnight. CGM data showing any of these patterns should prompt a fasting insulin and HOMA-IR test to confirm the degree of insulin resistance and guide intervention.