Blood Sugar Variability: Why Stable Glucose Matters More Than Averages
Glucose variability (CV above 36%) doubles hypoglycemia risk. SD, coefficient of variation, MAGE, and glycemic variability index explained. The DEVOTE trial and why flat glucose beats low averages.
What Is Blood Sugar Variability?
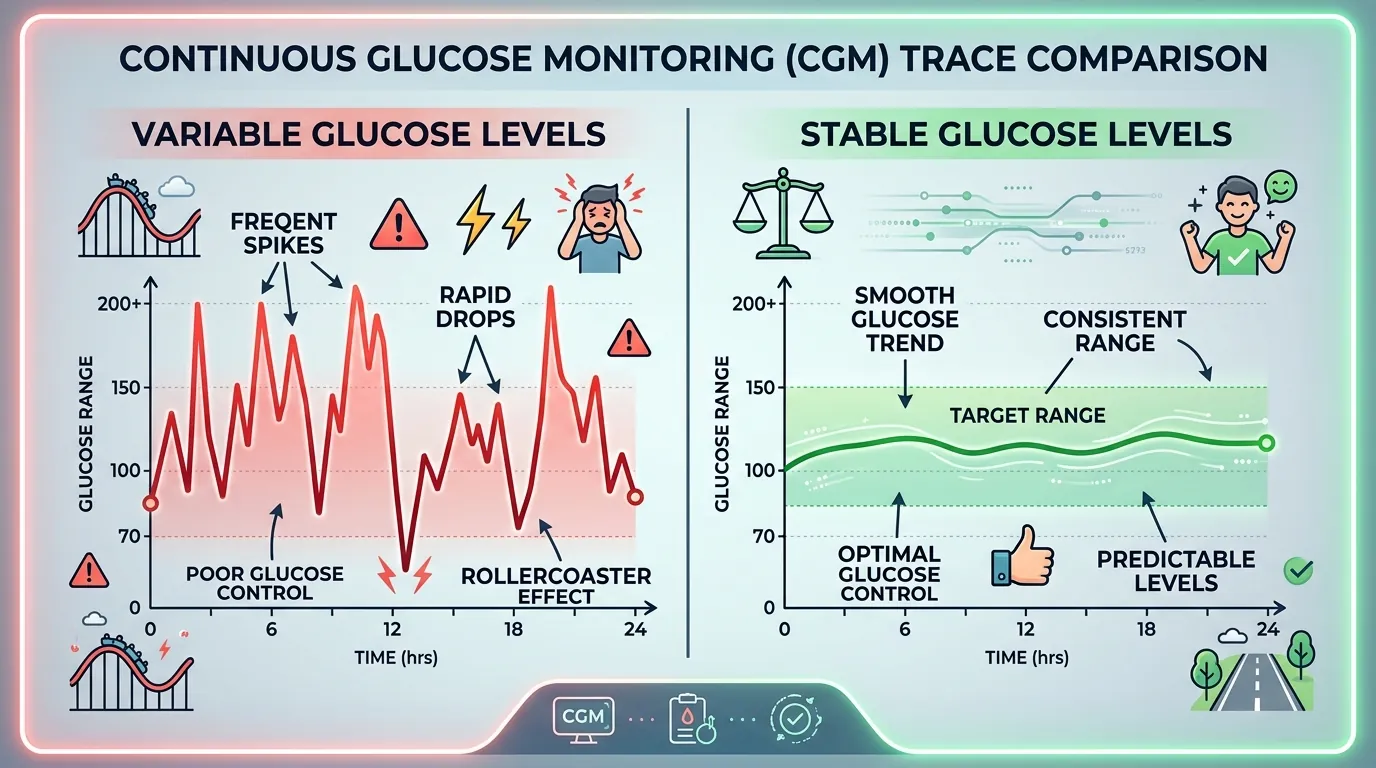
Blood sugar variability (glycemic variability, GV) is the degree of glucose fluctuation over time — the magnitude and frequency of rises and falls throughout the day. Two people with identical average glucose of 150 mg/dL can have vastly different variability profiles: one may fluctuate between 120 and 180 mg/dL (low variability, stable), while the other swings between 50 and 300 mg/dL (high variability, unstable). The second person has dramatically higher risk of hypoglycemia, greater oxidative stress, and worse quality of life despite the same average glucose and the same A1C. Blood sugar variability is invisible to A1C testing and fingerstick monitoring — it can only be comprehensively measured by a continuous glucose monitor that captures the minute-to-minute glucose trajectory. The clinical significance of glycemic variability was first proposed by Monnier et al. in 2006 (JAMA), who demonstrated that markers of oxidative stress (8-iso-prostaglandin F2alpha) correlated more strongly with glucose variability than with average glucose or A1C. This finding established that glucose swings cause direct cellular damage independent of chronic hyperglycemia, fundamentally changing how clinicians think about glucose control.
Key Metrics for Measuring Glucose Variability
Four metrics quantify glucose variability from CGM data, each capturing a different dimension of glucose fluctuation. The coefficient of variation (CV) is the most clinically validated metric — it is calculated as (standard deviation / mean glucose) x 100 and is expressed as a percentage. The 2019 International Consensus on Time in Range established a CV below 36% as the target for stable glucose control. A CV above 36% is associated with 2.3 times higher risk of hypoglycemia and indicates that glucose fluctuations are large relative to the average glucose level. Standard deviation (SD) measures the absolute dispersion of glucose readings around the mean in mg/dL. A target SD below 50 mg/dL for type 1 diabetes and below 40 mg/dL for type 2 diabetes indicates reasonable stability. The Mean Amplitude of Glycemic Excursions (MAGE) captures the average peak-to-nadir amplitude of significant glucose swings (defined as excursions exceeding one SD). MAGE values above 60 mg/dL in type 2 diabetes indicate clinically significant variability. The Glycemic Risk Assessment Diabetes Equation (GRADE) integrates the duration and severity of both hyperglycemia and hypoglycemia into a single risk score. CV is the preferred metric for clinical practice because it is independent of mean glucose — a CV of 30% indicates stable control whether the mean glucose is 120 or 200 mg/dL.
The DEVOTE Trial: Variability and Hypoglycemia Risk
The DEVOTE trial (Trial Comparing Cardiovascular Safety of Insulin Degludec vs Insulin Glargine in Patients with Type 2 Diabetes at High Risk of Cardiovascular Events) provided the most robust evidence linking glucose variability to adverse outcomes. Published in Diabetologia in 2018 by Zinman et al., the analysis included 7,637 participants with type 2 diabetes followed for a median of 2 years. The key findings were definitive: each 1 mg/dL increase in fasting glucose standard deviation was associated with a 1.4% increase in the rate of severe hypoglycemia and a 1.1% increase in cardiovascular mortality. Participants in the highest quartile of day-to-day fasting glucose variability had a 2.3-fold higher risk of severe hypoglycemia (requiring third-party assistance) compared to those in the lowest quartile. A secondary analysis showed that a CV above 36% was the threshold that best discriminated between stable and unstable glucose control. These findings have direct clinical implications: reducing glucose variability is as important as reducing average glucose, and CGMs are the only tool that measures variability in real time. The DEVOTE data also demonstrated that ultra-long-acting insulin analogs (degludec, with a half-life of 25 hours) produced 40% lower day-to-day fasting glucose variability compared to glargine (half-life 12 hours), establishing a pharmacological approach to variability reduction.
Why Flat Glucose Matters More Than Low Averages
A glucose profile that is flat (low variability) at a slightly higher average is healthier than one that is highly variable at a lower average. This counterintuitive principle is supported by three converging lines of evidence. First, the oxidative stress data: Monnier et al. (JAMA, 2006) and Ceriello et al. (Diabetes Care, 2008) demonstrated that glucose swings of 100+ mg/dL activate more endothelial oxidative damage markers than sustained hyperglycemia at the same mean glucose. Second, the hypoglycemia risk data: high variability mathematically increases the probability that glucose will cross into the dangerous below-54 mg/dL range, even when the average glucose is within target. A mean glucose of 130 mg/dL with SD of 60 mg/dL means 16% of readings will fall below 70 mg/dL (one standard deviation below the mean) and 2.5% will fall below 10 mg/dL in a normal distribution. The same mean glucose with SD of 25 mg/dL produces virtually no readings below 70 mg/dL. Third, the quality-of-life data: the INSPIRE study (2021, Diabetes Technology and Therapeutics) surveyed 1,200 CGM users and found that glucose variability (not average glucose or A1C) was the strongest predictor of diabetes distress, with each 10% increase in CV associated with a 15% increase in the Diabetes Distress Scale score. For CGM users, targeting a CV below 36% alongside a TIR above 70% produces the optimal balance of average glucose control and glucose stability.
Strategies to Reduce Blood Sugar Variability
Six evidence-based strategies reduce glucose variability as measured by CGM coefficient of variation. First, consistent carbohydrate distribution across meals reduces the glycemic load variability that drives postmeal swings — eating similar carbohydrate amounts at each meal (40-60 grams rather than 20 at lunch and 100 at dinner) reduces daily CV by 5 to 10 percentage points. Second, pre-meal protein or fat intake (the meal order effect described by Shukla et al., Diabetes Care, 2015) reduces postmeal spike amplitude by 30 to 73%, directly lowering MAGE. Third, post-meal walking for 10 to 15 minutes blunts the glucose peak by engaging muscle glucose uptake during the absorption window. Fourth, consistent sleep timing (within 30 minutes of the same bedtime and wake time) stabilizes the cortisol circadian rhythm that drives fasting glucose variability. Fifth, for insulin users, CGM-guided insulin dose timing — injecting rapid-acting insulin 15 to 20 minutes before meals rather than at the start of the meal — reduces the postmeal spike amplitude by 30 to 50% by matching insulin action onset to carbohydrate absorption. Sixth, closed-loop insulin pump systems (Medtronic 780G, Tandem Control-IQ, Omnipod 5) reduce CV by an average of 6 percentage points compared to manual insulin delivery by continuously adjusting basal insulin every 5 minutes based on CGM data. The combination of CGM monitoring and these behavioral strategies typically reduces CV from 40-50% to below 33% within 4 to 8 weeks.