Blood Sugar Charts: Reference Ranges for Adults and Children
Printable blood sugar reference charts — normal, prediabetes, and diabetes ranges for fasting, postmeal, A1C, pregnancy, pediatric, and CGM targets. Color-coded urgency levels.
Adult Blood Sugar Reference Chart
The adult blood sugar reference chart organizes diagnostic thresholds by measurement type and metabolic status. Fasting plasma glucose: normal is 70-99 mg/dL, prediabetes is 100-125 mg/dL, diabetes is 126 mg/dL or higher. Two-hour postprandial: normal is below 140 mg/dL, prediabetes is 140-199 mg/dL, diabetes is 200 mg/dL or higher. A1C: normal is below 5.7%, prediabetes is 5.7-6.4%, diabetes is 6.5% or higher. Random glucose: diabetes is 200 mg/dL or higher with classic symptoms regardless of fasting status. These thresholds are defined by the ADA 2024 Standards of Care and represent the point at which complication risk rises significantly above the population baseline. The fasting glucose threshold of 126 mg/dL was selected because epidemiological data from the Pima Indians Study (1997) and the Egyptian Diabetes Study (1998) showed a sharp inflection point in retinopathy prevalence at this level. The A1C threshold of 6.5% corresponds to the same retinopathy inflection point and was added as a diagnostic criterion in 2010. For CGM users, the standard target range of 70-180 mg/dL is used for Time in Range calculations, with more ambitious targets of 70-140 mg/dL used by non-diabetic wellness users and some clinicians for type 2 diabetes management.
Pediatric Blood Sugar Charts: Birth Through Adolescence
Blood sugar ranges for children vary by age group and clinical context. Newborns (0-48 hours): the lower threshold is 40 mg/dL for healthy term infants and 45 mg/dL for premature or low-birth-weight infants. A blood sugar below 25 mg/dL in a newborn is a medical emergency requiring IV dextrose. Infants 1-12 months: fasting glucose of 60-100 mg/dL is normal; postmeal glucose should remain below 150 mg/dL. Toddlers 1-5 years: fasting glucose of 70-100 mg/dL with slightly wider postmeal excursions up to 160 mg/dL due to erratic eating patterns. School-age children 6-12 years: fasting glucose of 70-100 mg/dL with postmeal targets matching adult ranges (below 140 mg/dL for non-diabetic, below 180 mg/dL for diabetes management). Adolescents 13-17 years: identical ranges to adults but with unique challenges — puberty hormones (growth hormone, sex steroids) increase insulin resistance by 30 to 50% during Tanner stages 3-4, resulting in higher average glucose and A1C despite appropriate insulin therapy. The ADA recommends CGM for all children with type 1 diabetes and sets a TIR target of at least 70% (with time below 70 mg/dL less than 4%), though the T1D Exchange registry data shows that only 17% of adolescents currently meet this target. Pediatric CGM studies consistently demonstrate improved parental sleep quality and reduced fear of nocturnal hypoglycemia.
Pregnancy Blood Sugar Targets
Pregnancy requires the tightest glucose control of any clinical population due to the direct transfer of maternal glucose to the fetus through the placental circulation. The ADA 2024 Standards of Care recommend the following targets for women with gestational diabetes or pre-existing diabetes during pregnancy: fasting glucose of 60-95 mg/dL (lower than the standard 70-99 mg/dL for non-pregnant adults), 1-hour postmeal glucose below 140 mg/dL, and 2-hour postmeal glucose below 120 mg/dL. The HAPO study (2008, 23,316 women across 15 centers in 9 countries) established that hyperglycemia below the traditional diabetes threshold still increases adverse pregnancy outcomes in a continuous, dose-dependent manner — there is no glucose level below which risk reaches zero. For CGM users during pregnancy, the target range is 63-140 mg/dL with a TIR goal of at least 70% (approximately 16.8 hours per day in range). The CONCEPTT trial (Feig et al., The Lancet, 2017) demonstrated that CGM use during pregnancy reduced large-for-gestational-age births by 37%, reduced neonatal hypoglycemia requiring IV dextrose by 50%, and reduced NICU admissions by 1 day compared to fingerstick-only monitoring. A1C targets during pregnancy are below 6.0% in the first trimester and below 6.5% thereafter, reflecting the need for tight control balanced against the increased hypoglycemia risk that pregnancy creates.
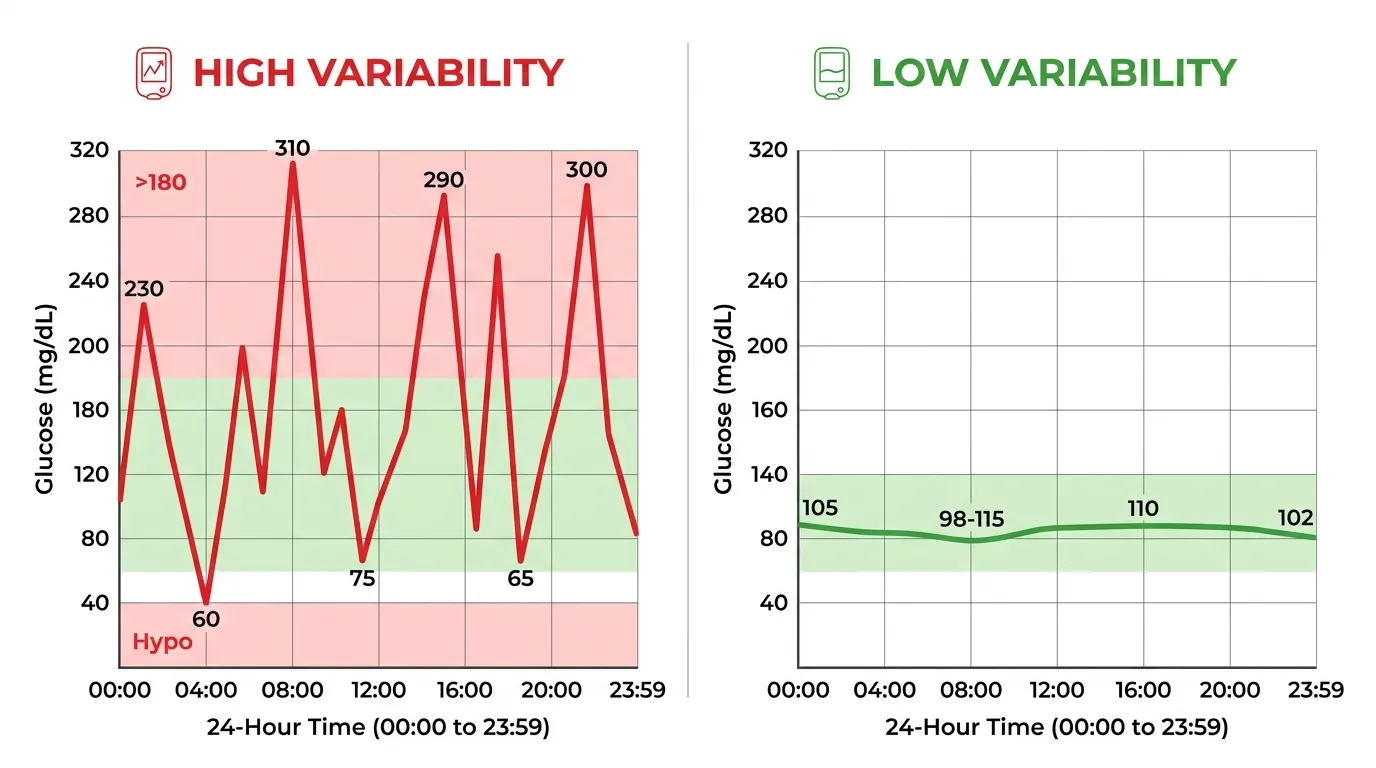
CGM Target Ranges and Color-Coded Urgency Levels
CGM systems and glucose reports use a standardized color-coding system established by the 2019 International Consensus on Time in Range to help users and clinicians quickly interpret glucose data. Very high glucose (above 250 mg/dL) is displayed in red — the target is less than 5% of readings in this range (less than 1.2 hours per day). High glucose (181-250 mg/dL) is displayed in yellow or orange — the target is less than 25% combined with the very high range. In range (70-180 mg/dL) is displayed in green — the target is at least 70% (at least 16.8 hours per day). Low glucose (54-69 mg/dL) is displayed in red — the target is less than 4% (less than 1 hour per day). Very low glucose (below 54 mg/dL) is displayed in dark red — the target is less than 1% (less than 15 minutes per day). These targets apply to type 1 and type 2 diabetes. For pregnancy, the target range narrows to 63-140 mg/dL with TIR of at least 70%. For older adults with comorbidities, the target range widens to 70-250 mg/dL with TIR of at least 50%. The AGP report generated by Dexcom Clarity, LibreView, and Tidepool displays these metrics in a standardized format with color-coded time-in-range bars, a glucose trace overlay showing median and interquartile range, and a summary table of key metrics including TIR, TBR, TAR, GMI, and glucose coefficient of variation.
A1C-to-Average Glucose Conversion Chart
The A1C-to-estimated Average Glucose (eAG) conversion is based on the ADAG study formula: eAG (mg/dL) = 28.7 x A1C - 46.7. The following reference values are used by endocrinologists and displayed on CGM reports worldwide. A1C 5.0% equals eAG 97 mg/dL. A1C 5.5% equals 111 mg/dL. A1C 5.7% equals 117 mg/dL, marking the prediabetes threshold. A1C 6.0% equals 126 mg/dL. A1C 6.5% equals 140 mg/dL, the diabetes diagnostic cutoff. A1C 7.0% equals 154 mg/dL, the standard management target for most adults with diabetes. A1C 7.5% equals 169 mg/dL. A1C 8.0% equals 183 mg/dL. A1C 8.5% equals 197 mg/dL. A1C 9.0% equals 212 mg/dL. A1C 10.0% equals 240 mg/dL. A1C 11.0% equals 269 mg/dL. A1C 12.0% equals 298 mg/dL. The Glucose Management Indicator (GMI) from CGM data uses a slightly different formula — GMI (%) = 3.31 + (0.02392 x mean glucose mg/dL) — and may differ from lab A1C by up to 0.5% in either direction due to individual variation in hemoglobin glycation rates, red blood cell lifespan, and hemoglobin variants. Both A1C and GMI should be used together for the most complete assessment of long-term glucose control.