Understanding Blood Sugar: Normal Ranges, 7 Testing Methods, and What Your Numbers Mean
Blood sugar — clinically called blood glucose — is the concentration of glucose circulating in your bloodstream at any given moment, measured in milligrams per deciliter (mg/dL). This guide covers every dimension of blood sugar: normal ranges by age and test type, the 9 factors that cause levels to rise and fall, how 7 testing methods compare in accuracy and data density, and why continuous glucose monitors have fundamentally changed how people understand their metabolic health.
What Is Blood Sugar?
Blood sugar (blood glucose) is the primary fuel source for every cell in the human body. Glucose is a simple sugar derived from the carbohydrates, proteins, and fats you eat, and it circulates through the bloodstream to reach muscles, organs, and the brain. At any given moment, a healthy adult has approximately 4 grams of glucose dissolved in the entire bloodstream — roughly one teaspoon. This small quantity is tightly regulated because both too little and too much glucose cause serious harm. The body maintains blood sugar within a narrow range of 70 to 140 mg/dL for the vast majority of the day through a hormonal feedback system involving insulin, glucagon, and the liver.
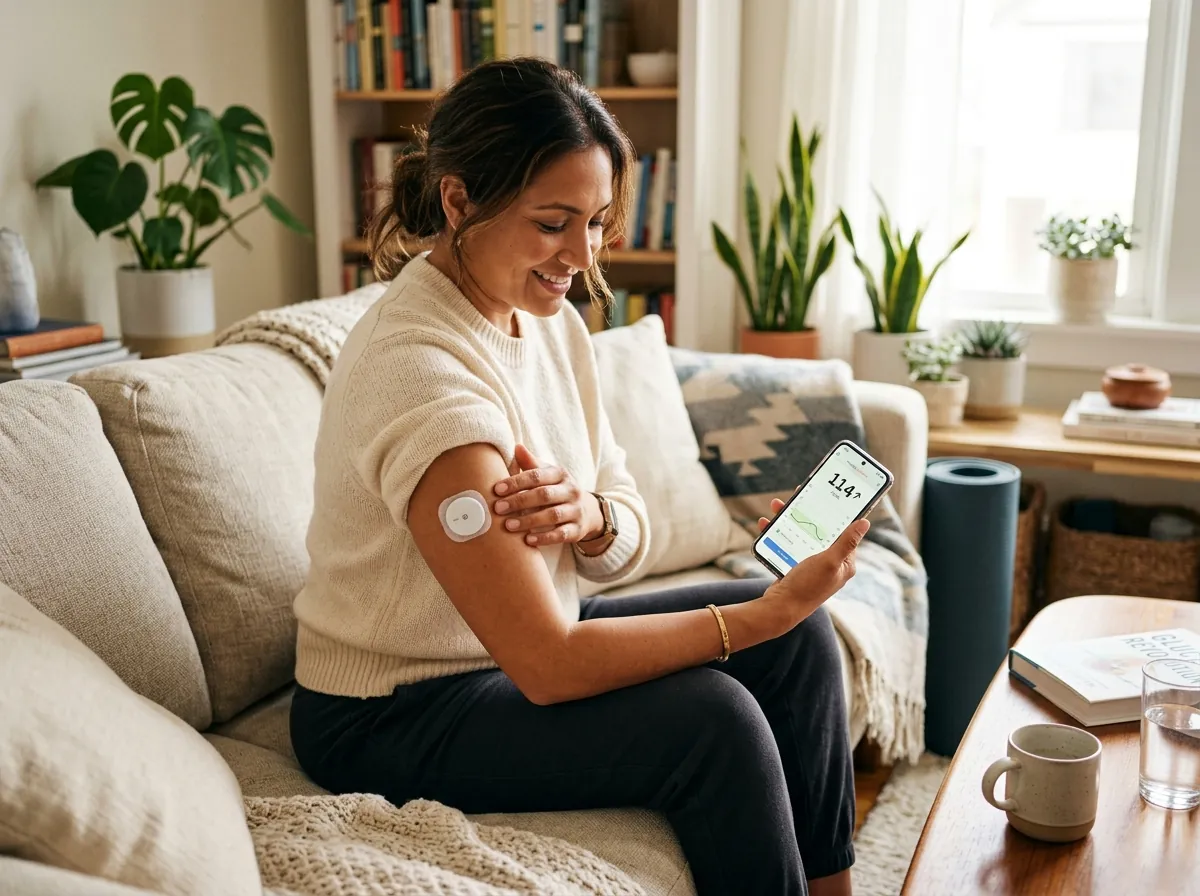
Glucose is a monosaccharide — the simplest form of carbohydrate — with the molecular formula C6H12O6. When you eat a meal containing carbohydrates, digestive enzymes break complex starches and sugars into individual glucose molecules, which are absorbed through the small intestine into the bloodstream. The speed of this absorption varies dramatically: pure glucose enters the blood within 15 minutes, while complex carbohydrates paired with fiber, fat, and protein can take 60 to 120 minutes to fully absorb. This absorption rate is what determines the height and duration of a postmeal blood sugar spike — a concept that a continuous glucose monitor visualizes as a real-time trend line on your smartphone. Understanding blood sugar begins with recognizing that glucose is not inherently harmful. It is the concentration — how much glucose is in the blood at a specific time — and the duration — how long elevated levels persist — that determine health outcomes.
Normal Blood Sugar Ranges
Normal fasting blood sugar ranges from 70 to 99 mg/dL in adults who do not have diabetes, according to the American Diabetes Association (ADA) 2024 Standards of Care. These reference ranges are the foundation for diagnosing prediabetes and diabetes, and they apply to venous blood samples drawn after at least 8 hours of fasting. The table below summarizes the 5 key blood sugar measurements and their clinical thresholds.
| Measurement | Normal | Prediabetes | Diabetes |
|---|---|---|---|
| Fasting glucose | 70-99 mg/dL | 100-125 mg/dL | ≥126 mg/dL |
| 2-hour postprandial | <140 mg/dL | 140-199 mg/dL | ≥200 mg/dL |
| A1C | <5.7% | 5.7-6.4% | ≥6.5% |
| Random glucose | <140 mg/dL | N/A | ≥200 mg/dL + symptoms |
| OGTT (2-hour) | <140 mg/dL | 140-199 mg/dL | ≥200 mg/dL |
A 2018 Stanford University study led by Dr. Michael Snyder published in PLOS Biology found that non-diabetic adults wearing CGMs spent 96% of the day between 70 and 140 mg/dL, but experienced postmeal glucose excursions above 140 mg/dL after 24% of meals — a finding invisible to standard fasting glucose tests. This research demonstrated that even “normal” blood sugar involves dynamic fluctuations throughout the day, and that continuous glucose monitoring reveals metabolic variability that single-point tests cannot capture. For age-specific ranges and pediatric thresholds, see the normal blood sugar levels guide.
How Blood Sugar Is Regulated
Insulin and glucagon are the two primary hormones that regulate blood sugar, working in opposition to maintain glucose within the 70-140 mg/dL range. This hormonal feedback system operates continuously, adjusting glucose levels every few minutes based on meals, physical activity, stress, and dozens of other inputs. The pancreas — a 6-inch organ located behind the stomach — is the control center of this system, containing approximately 1 million islets of Langerhans, each packed with hormone-producing cells.
Insulin is a peptide hormone secreted by the pancreatic beta cells when blood sugar rises above approximately 100 mg/dL. It functions as a key that unlocks cell membranes, allowing glucose to move from the bloodstream into muscle, fat, and liver cells. A healthy pancreas releases insulin in two phases: a rapid first-phase burst within 5 to 10 minutes of eating (suppressed in type 2 diabetes), followed by a sustained second-phase release that lasts 1 to 3 hours. Insulin also signals the liver to convert excess glucose into glycogen — a storage form — and to suppress the release of new glucose into the blood. In type 1 diabetes, the immune system destroys beta cells, eliminating insulin production entirely. In type 2 diabetes, cells become resistant to insulin's signal, requiring the pancreas to produce 2 to 5 times more insulin to achieve the same glucose-lowering effect — a condition called insulin resistance.
Glucagon is insulin's counterpart, secreted by the pancreatic alpha cells when blood sugar drops below approximately 70 mg/dL. It signals the liver to break down stored glycogen into glucose and release it into the bloodstream — a process called glycogenolysis. The liver stores approximately 100 grams of glycogen, enough to maintain blood sugar for 12 to 18 hours during fasting. When glycogen stores are depleted (during prolonged fasting or intense exercise), the liver switches to gluconeogenesis — manufacturing new glucose from amino acids, lactate, and glycerol. This entire regulatory system is visible on a CGM glucose report as the smooth overnight baseline and the postmeal rise-and-return pattern that healthy metabolism produces.
What Causes Blood Sugar to Rise and Fall: 9 Factors
Blood sugar is influenced by at least 9 major factors beyond food intake, and understanding these factors is essential for interpreting glucose data from any testing method. A continuous glucose monitor makes these influences visible by capturing glucose changes minute by minute, revealing correlations that fingerstick testing cannot detect.
1. Food and Carbohydrates
Carbohydrate quantity and type are the strongest determinants of postmeal glucose. 50 grams of white bread raises blood sugar by 80-120 mg/dL within 30 minutes. The same 50 grams from lentils raises blood sugar by 20-40 mg/dL over 90 minutes due to fiber and resistant starch.
2. Physical Stress and Cortisol
Psychological and physical stress trigger cortisol release, which raises blood sugar by 30 to 50 mg/dL by stimulating liver glucose output. A 2019 Ohio State University study found that work-related stress increased fasting glucose by an average of 18 mg/dL in non-diabetic adults.
3. Exercise
Aerobic exercise lowers blood sugar by 20 to 60 mg/dL by increasing insulin-independent glucose uptake in muscles. Intense resistance training can temporarily raise blood sugar by 30-50 mg/dL due to adrenaline and cortisol release before dropping below baseline 1-2 hours later.
4. Sleep Quality
A single night of 4-hour sleep reduces insulin sensitivity by 25%, per a University of Chicago study (Spiegel et al., 1999). Poor sleep increases cortisol and reduces the first-phase insulin response, leading to higher postmeal glucose spikes the following day.
5. Illness and Infection
The immune response to infection raises blood sugar through counter-regulatory hormones. Even a common cold can increase fasting glucose by 20 to 40 mg/dL. Serious infections like pneumonia or urinary tract infections can push blood sugar above 300 mg/dL in people with diabetes.
6. Medications
Corticosteroids (prednisone) raise blood sugar by 40 to 100+ mg/dL by increasing insulin resistance and liver glucose output. Thiazide diuretics, beta-blockers, and atypical antipsychotics also elevate glucose. Metformin and SGLT2 inhibitors lower it by 20-60 mg/dL.
7. Hormones and Menstrual Cycle
Progesterone increases insulin resistance during the luteal phase (days 15-28), raising average blood sugar by 5 to 15 mg/dL. Growth hormone surges during puberty and pregnancy also affect glucose regulation. CGM data makes these cyclical patterns visible for the first time.
8. Dawn Phenomenon
Between 3 AM and 8 AM, cortisol, growth hormone, and glucagon rise naturally, causing the liver to release glucose. This dawn phenomenon affects 50% of people with diabetes and raises fasting blood sugar by 20-60 mg/dL.
9. Alcohol
Alcohol inhibits liver gluconeogenesis, which can lower blood sugar by 30 to 70 mg/dL in the 6-12 hours after consumption. This delayed hypoglycemic effect is particularly dangerous for people on insulin or sulfonylureas and is a leading cause of nocturnal hypoglycemia.
The interaction between these 9 factors explains why two identical meals eaten on different days can produce glucose spikes that differ by 40 to 80 mg/dL — a phenomenon documented by researchers at the Weizmann Institute of Science in a landmark 2015 Cell study involving 800 participants wearing CGMs for 7 days. For specific strategies to manage each trigger, see the blood sugar spikes guide.
Blood Sugar Testing Methods Compared: 7 Approaches
Seven distinct methods exist for measuring blood sugar, ranging from a single lab draw to continuous monitoring that captures 288+ readings per day. Each method serves a different purpose, offers different accuracy, and provides a different depth of metabolic information. The table below compares the 5 most common clinical methods.
| Method | Readings/Day | Accuracy | Monthly Cost | Best For |
|---|---|---|---|---|
| CGM | 288-1,440 | MARD 7.9-9.1% | $75-300 | Trend analysis, TIR, pattern detection |
| Fingerstick meter | 4-10 | ±15% | $15-75 | Point-in-time confirmation, CGM calibration |
| Lab fasting glucose | 1 (per visit) | Gold standard | $15-100 | Diagnosis, baseline screening |
| A1C test | 1 (per 3 months) | 3-month average | $25-50 | Long-term glucose control assessment |
| OGTT | 1 (diagnostic) | Diagnostic gold standard | $50-150 | Gestational diabetes, prediabetes diagnosis |
The two additional methods — urine glucose testing (outdated, only detects glucose above 180 mg/dL renal threshold) and fructosamine testing (measures glycated albumin over 2-3 weeks, useful when A1C is unreliable due to hemoglobin variants) — serve niche roles. For a comprehensive comparison including sensor specifications and insurance coverage, see the blood sugar testing methods guide.
Why Continuous Glucose Monitoring Reveals More Than Single Tests
A CGM captures 288 glucose readings per day compared to 4-10 fingerstick readings, and this 30x to 70x increase in data density transforms blood sugar from a series of disconnected snapshots into a continuous narrative. The clinical significance of this difference was established by a 2017 randomized controlled trial (DIAMOND study, published in JAMA) involving 158 adults with type 1 diabetes: CGM users achieved a 0.6% greater A1C reduction and spent 2.9 fewer hours per day in hypoglycemia compared to fingerstick-only users over 24 weeks.
The transformative metric enabled by CGMs is Time in Range (TIR) — the percentage of the day that glucose stays between 70 and 180 mg/dL. An international consensus panel (Battelino et al., 2019, Diabetes Care) established that TIR of 70% or higher corresponds to an A1C of approximately 7.0% and is associated with reduced risk of diabetic retinopathy and microalbuminuria. TIR cannot be calculated from fingerstick data — it requires the continuous data stream that only a CGM provides. Similarly, trend arrows that show whether glucose is rising, falling, or stable are unique to CGM technology and allow users to make proactive decisions rather than reactive ones.
Beyond clinical diabetes management, CGM data reveals metabolic patterns relevant to non-diabetic users pursuing metabolic wellness. A 2020 study at Stanford University (Hall et al., Cell Metabolism) equipped 57 non-diabetic participants with CGMs and found that 12% met the diagnostic criteria for prediabetes despite having normal fasting glucose and A1C values — identified only because the CGM captured postmeal glucose excursions above 200 mg/dL that resolved before the next fasting test. This finding underscores the limitation of single-point testing and the diagnostic power of continuous monitoring. For a ranked comparison of every CGM device available today, see the best continuous glucose monitors in 2026.
Blood Sugar and Long-Term Health
Chronically elevated blood sugar above 154 mg/dL (A1C 7.0%) progressively damages blood vessels, nerves, kidneys, and the retina through a process called glucotoxicity. The landmark DCCT trial (Diabetes Control and Complications Trial, 1993) and its 30-year follow-up study EDIC (Epidemiology of Diabetes Interventions and Complications) proved that every 1% reduction in A1C decreases the risk of microvascular complications by 35-40%. The ADA 2024 Standards of Care recommend the following A1C targets.
A1C <7.0% — Standard target for most adults with diabetes. Corresponds to an average glucose of 154 mg/dL and TIR ≥70%.
A1C <6.5% — More aggressive target for younger adults, newly diagnosed patients, and those without hypoglycemia risk. Average glucose of 140 mg/dL.
A1C <8.0% — Relaxed target for elderly patients, those with limited life expectancy, or individuals with severe hypoglycemia unawareness. Average glucose of 183 mg/dL.
The relationship between blood sugar levels and complication risk is not linear — it is exponential above A1C 7.0%. A person with A1C of 9.0% has 4 to 6 times the retinopathy risk of someone at 7.0%, and 8 to 10 times the nephropathy risk of someone at 6.5%. This exponential curve is why the first percentage point of A1C reduction yields far greater health benefits than subsequent reductions. CGMs contribute to better long-term outcomes by making every glucose excursion visible and actionable in real time, rather than waiting 3 months for an A1C result. For condition-specific guidance, see the CGM for health conditions guide.
Understanding Your Numbers: 4 Key CGM Metrics
Four metrics derived from CGM data provide a more complete picture of glucose control than A1C alone. The 2019 International Consensus on Time in Range (Battelino et al.) established clinical targets for each metric, and these are now included in the standard AGP (Ambulatory Glucose Profile) report generated by every major CGM platform.
Time in Range (TIR)
Target: ≥70% of readings between 70-180 mg/dL. TIR measures the percentage of time glucose stays within the target range. Each 5% increase in TIR corresponds to clinically meaningful reductions in complication risk. A TIR of 70% equals approximately 16.8 hours per day in range.
Glucose Variability (CV)
Target: coefficient of variation (CV) <36%. CV measures how much glucose fluctuates around the mean. A CV above 36% indicates unstable glucose and is associated with 2.3 times higher risk of hypoglycemia (DEVOTE trial, 2017). CV is calculated as standard deviation divided by mean glucose, multiplied by 100.
Glucose Management Indicator (GMI)
GMI estimates A1C from CGM data using the formula: GMI = 3.31 + (0.02392 × mean glucose in mg/dL).GMI requires at least 14 days of CGM data with sensor active ≥70% of the time. GMI and lab A1C may differ by up to 0.5% due to individual variation in hemoglobin glycation rates.
Time Below Range (TBR)
Target: <4% of readings below 70 mg/dL and <1% below 54 mg/dL. TBR quantifies hypoglycemia exposure. Reducing TBR is as clinically important as increasing TIR. CGM alerts that warn 10-30 minutes before glucose reaches 70 mg/dL have reduced severe hypoglycemia events by 72% in clinical trials.
For a deeper exploration of glucose variability and why stable glucose matters more than low averages, see the blood sugar variability guide. For detailed explanations of TIR and its relationship to A1C, see the Time in Range guide.
Deep Dives: Blood Sugar Topics
Normal Blood Sugar Levels by Age, Time of Day, and Test Type
Read guide →
Fasting Blood Sugar: What 70-100 mg/dL Means for Your Health
Read guide →
Blood Sugar After Eating: 1-Hour and 2-Hour Postprandial Targets
Read guide →
What Causes Blood Sugar Spikes: 9 Triggers and Prevention Strategies
Read guide →
Dawn Phenomenon: Why Blood Sugar Rises Before Breakfast
Read guide →
Blood Sugar and A1C: How Daily Readings Convert to 3-Month Averages
Read guide →
Low Blood Sugar (Hypoglycemia): Symptoms, Causes, and Emergency Response
Read guide →
High Blood Sugar (Hyperglycemia): Warning Signs and When to Seek Help
Read guide →
Blood Sugar Testing Methods Compared: CGM vs Fingerstick vs Lab A1C
Read guide →
Blood Sugar Charts: Reference Ranges for Adults and Children
Read guide →
Blood Sugar Variability: Why Stable Glucose Matters More Than Averages
Read guide →
When Blood Sugar Signals Deeper Problems
Isolated blood sugar readings tell only part of the story — when fasting glucose consistently exceeds 100 mg/dL and 3 or more cardiometabolic markers fall outside optimal ranges, the underlying issue is often metabolic syndrome or insulin resistance, conditions that affect 88% of American adults to some degree. A single glucose number cannot capture whether the body's insulin response, lipid metabolism, and inflammatory pathways are functioning correctly. For a complete guide to the 5 diagnostic markers that define metabolic dysfunction and how CGMs detect it years before standard blood tests, see the metabolic health guide.
Related Resources
- How Continuous Glucose Monitors Work: 9 Core Technologies Explained — Sensor types, MARD accuracy, calibration, and data transmission explained.
- CGM for Health Conditions — Type 1, Type 2, gestational diabetes, prediabetes, and metabolic wellness applications.
- Best CGMs for Blood Sugar Monitoring in 2026 — Data-driven rankings of every continuous glucose monitor by accuracy, wear time, and features.
- CGM Cost and Insurance Coverage — Monthly pricing from $75 to $300, insurance eligibility, and OTC options starting at $49.
- CGM and Blood Sugar Terminology — Definitions for every term used in continuous glucose monitoring.
- CGM Brands and Manufacturers — Full specifications for Dexcom, Abbott, Medtronic, and Senseonics devices.