Intermittent fasting (IF) has become one of the most popular dietary strategies in the world, with an estimated 24 percent of American adults having tried some form of time-restricted eating. A continuous glucose monitor offers a unique window into what actually happens to blood sugar during fasting periods—and the data often surprises people.
What CGM Data Shows During a Fast
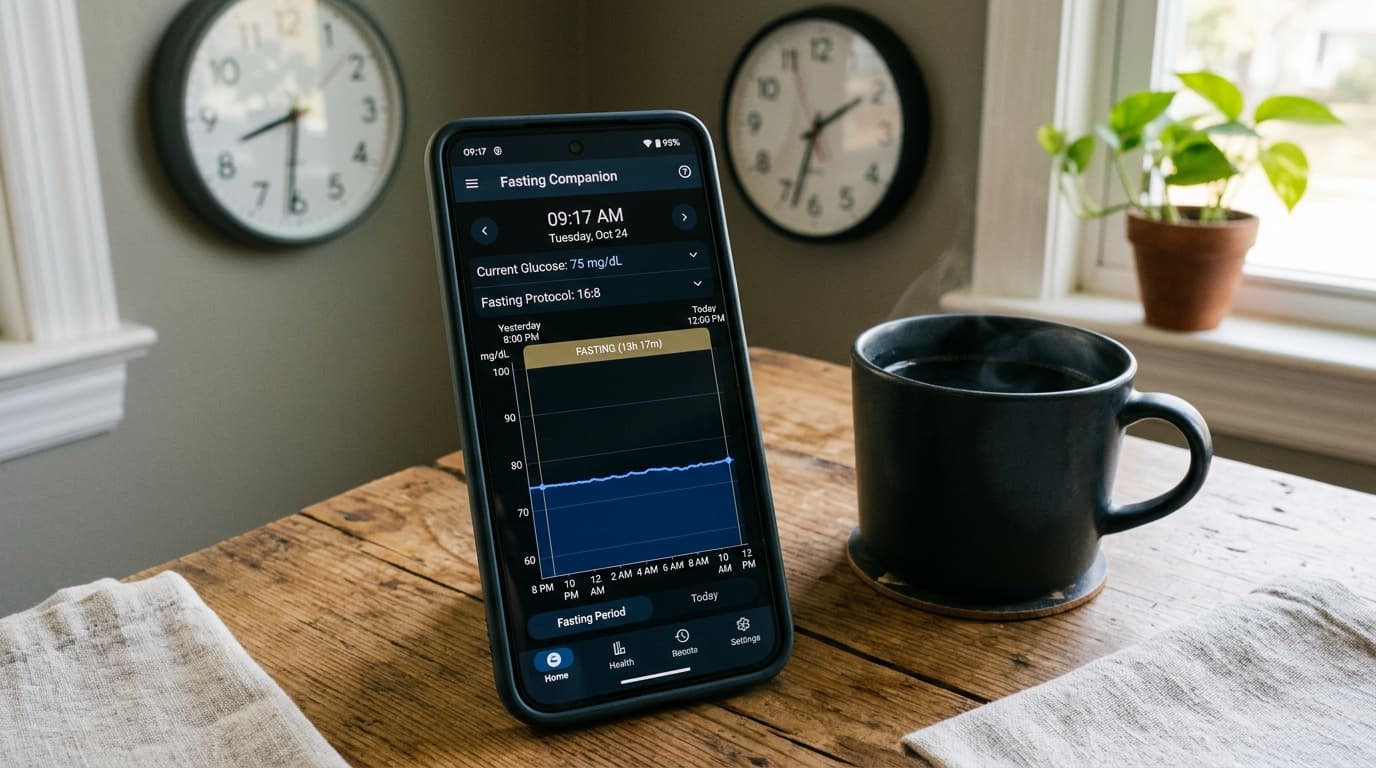
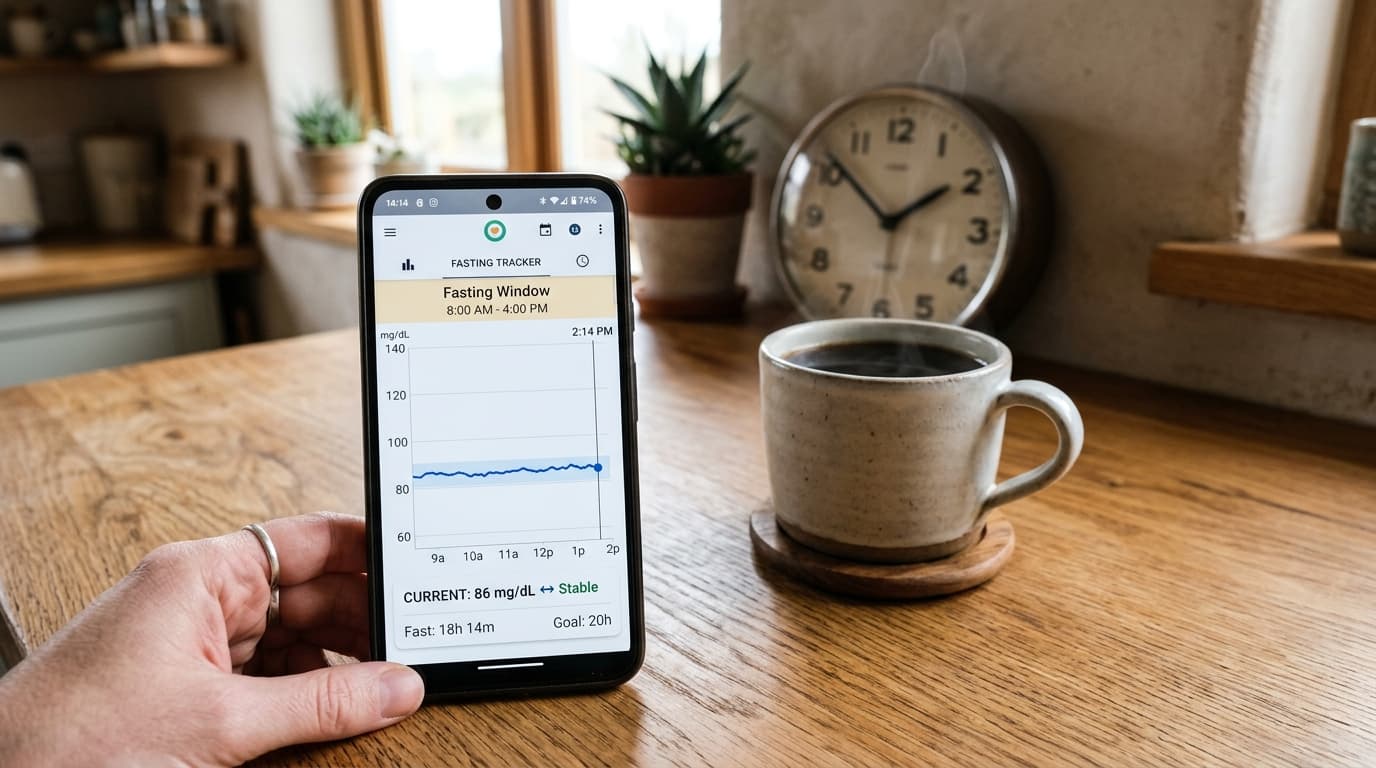
The first thing most CGM users notice during an extended fast (16-20 hours) is how stable their glucose becomes. Without incoming carbohydrates, the pancreas produces minimal insulin, and the liver gradually increases glucose output from glycogen stores to maintain a steady blood sugar level.
During a typical 16:8 intermittent fasting protocol (16 hours fasting, 8-hour eating window), CGM data reveals a characteristic pattern:
- **Hours 0-4 (post-dinner):** Glucose declines from the last meal's peak back to baseline, typically reaching 85-95 mg/dL. - **Hours 4-12 (overnight):** Glucose stabilizes in the 75-90 mg/dL range with minimal variability—often the flattest portion of the 24-hour graph. - **Hours 12-16 (morning fast):** A modest rise of 5-15 mg/dL occurs due to the dawn phenomenon (cortisol-driven hepatic glucose output). Fasting glucose at the 16-hour mark typically reads 80-100 mg/dL in metabolically healthy adults.
The key insight: glucose variability (measured as coefficient of variation) drops by 20-35 percent during fasting windows compared to eating windows, according to data published in the journal Cell Metabolism.
The Dawn Phenomenon During Fasting
One counterintuitive finding that surprises intermittent fasting practitioners: blood sugar often rises in the morning even though no food has been consumed. This is the dawn phenomenon, caused by a natural cortisol surge that triggers the liver to release stored glucose.
In non-fasting individuals, the dawn rise is typically counteracted by insulin released in response to breakfast. During a fast, this insulin response does not occur, so the glucose elevation can persist for 2-3 hours. CGM data from intermittent fasters commonly shows a morning glucose peak of 100-115 mg/dL that gradually subsides.
This is a normal physiological response, not a sign of metabolic dysfunction. However, people with insulin resistance may experience exaggerated dawn phenomenon readings of 120-140 mg/dL during fasting, which can be a useful diagnostic signal that warrants medical evaluation.
Glucose Stability Improvements Over Time
Regular intermittent fasters often see measurable improvements in their CGM metrics over 4-8 weeks:
- **Average glucose:** Decreases by 5-10 mg/dL as insulin sensitivity improves - **Glucose variability:** Coefficient of variation drops from 20-25 percent to 15-20 percent - **Post-meal spikes:** The first meal after a fast may initially cause a larger-than-normal glucose spike (due to reduced insulin priming), but this effect diminishes as the body adapts - **Time in range:** Increases by 5-10 percentage points on a 70-140 mg/dL target
A 2023 study in Obesity followed 120 adults with a BMI of 28-35 who practiced 16:8 fasting for 12 weeks. CGM data showed that the fasting group's mean 24-hour glucose decreased from 104 mg/dL to 96 mg/dL, while the control group remained unchanged at 103 mg/dL.
Who Benefits Most
CGM data consistently shows that intermittent fasting produces the most dramatic glucose improvements in people who start with some degree of metabolic dysfunction:
- **Prediabetes (A1C 5.7-6.4):** IF combined with CGM monitoring shows 15-20 mg/dL reductions in fasting glucose over 8 weeks. - **Insulin resistance (HOMA-IR > 2.5):** Post-meal glucose spikes decrease by 20-30 percent as insulin sensitivity improves. - **Overweight individuals (BMI 27+):** The combination of caloric restriction and improved insulin signaling produces weight loss of 3-5 kg over 12 weeks.
For metabolically healthy, normal-weight adults, the glucose improvements from intermittent fasting are modest—typically 3-5 mg/dL reductions in average glucose—because their glucose regulation is already efficient.
Potential Risks to Monitor with CGM
Intermittent fasting is not appropriate for everyone, and a CGM can identify warning signs:
- **Hypoglycemia during fasts:** If glucose drops below 70 mg/dL during a fasting window, especially with symptoms (dizziness, shakiness), the fasting window may be too long or medications may need adjustment. - **Excessive post-fast spikes:** Some people experience exaggerated glucose spikes (above 180 mg/dL) when breaking a fast with carbohydrates. Breaking the fast with protein and fat first, then adding carbohydrates, produces smoother glucose curves. - **Disordered eating patterns:** CGM data should not be used to justify excessively restrictive eating windows. If fasting triggers anxiety about glucose numbers, the psychological cost may outweigh the metabolic benefit.
A continuous glucose monitor transforms intermittent fasting from a one-size-fits-all protocol into a personalized experiment with real-time feedback. The data shows exactly how your body responds—and that individual response varies far more than any fasting guru would suggest.